Filters and Sorting
Table of Contents
Each module within SILEXX OEMS that presents data in a spreadsheet format has built in data filtering and sorting functions that allow you to easily organize long sets of trading data.
1. Sorting Data
1.1 Left-click a column header of the spreadsheet to sort the entire spreadsheet in an ascending or descending fashion based on the data in the selected column.

-
A. Columns that have sorting enabled will have either:
-
 an up arrow (ascending)
  or down arrow (descending) next to the column name.
-
-
B. Examples:
-
 Data on the spreadsheet is sorting in ascending order (a-z) based on the underlying Symbol
  Data on the spreadsheet is sorting in descending order (z-a) based on the underlying Symbol
-
1.2 Right-click a column header and select Sort Ascending or Sort Descending

-
A. Columns that have sorting enabled will have either:
-
an up arrow (ascending)
- or down arrow (descending) next to the column name.
-
-
B. Examples:
-
Data on the spreadsheet is sorting in ascending order (a-z) based on the underlying Symbol
- Data on the spreadsheet is sorting in descending order (z-a) based on the underlying Symbol
-
1.3 Clear Sorting
- Data will continue to be sorted by the selected column until either another column is selected for sorting, or the sorting function is manually turned off.
- Right-click the column header that has sorting applied and select Clear Sorting
![]()
2. Simple Data Filters
2.1 The basic filtering function excludes from view all data except for that which you state you want to view.
-
Hover the mouse icon over a column header until you see a funnel icon

- Left-click the funnel icon and select the data field for which you want to exclusively view

The filter list available is based on the data listed in the selected column. Recently used filters are presented at the top of the list.
| Field | Description |
|---|---|
| Custom | Build a custom filter |
| Blanks | Show only data with a blank value in the selected column (exclude filled cells) |
| Non Blanks | Show only data with value in the selected column (exclude blank cells) |
In this example, we have selected to filter the data based on the Underlying symbol MSFT on the Portfolio module.
Only those trades that have MSFT as the Underlying symbol (options included) will now be visible in the Portfolio; all other data will be hidden from view (they are not deleted, only hidden from view).
Tip #1: Multiple basic filters can be applied simultaneously. Simply repeat the above process on additional data columns.
Tip #2: You can combine filtering and column sorting to further refine your data organization. Simply left-click any column header while in filtering mode to add sorting to the view.
3. Activating, Deactivating and Removing Filters
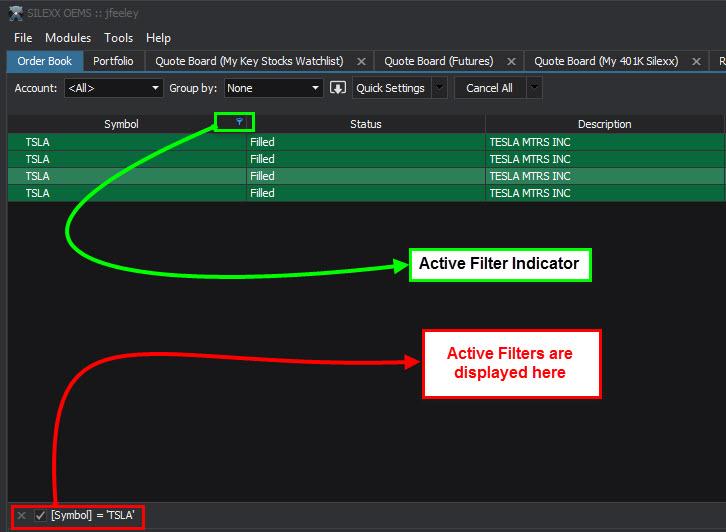
A funnel icon will remain in the column header as an indicator that a filter is active.
- Active filters are shown and controlled in the lower left corner of the module.
- Remove Filter Click the X to remove all filters
- Toggle on/off Click the checkbox to activate or deactivate the current filter
- Select Filter Click the arrow to switch to a previously created filter
3.1 Alternative Filter Clearing
- Right-click the column header with the active filter and select Clear Filter
![]()
4. Building Custom Filters
4.1 Getting started
- You can build your own custom filters using the Filter Editor.
![]()
- The editor can be accessed in the following ways:
- A. Right-click a column header and select Filter Editor...

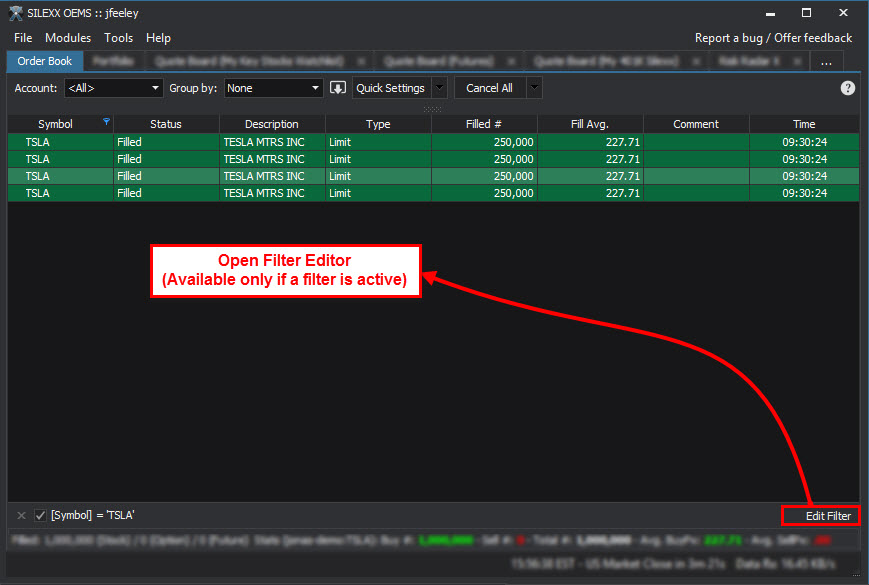
- B. Click Edit Filter in the lower right corner of the screen (when a filter is active)
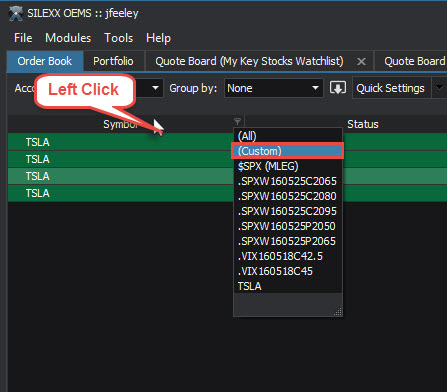
- C. Left-click the funnel icon on a column header and select (Custom) to create a custom basic filter![]
- A. Right-click a column header and select Filter Editor...
4.2 Filter Editor
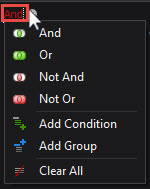
- The Filter Editor is based around logic operators and condition statements:

- A. Logical Operators
- Logic operators control how the filter displays the data that is defined by the condition statements.
Click the operator name in the Filter Editor to change the operator type.
- Logic operators control how the filter displays the data that is defined by the condition statements.
Click the operator name in the Filter Editor to change the operator type.
| Operator | Definition | Sample Filter Construct | Sample Filter Display | |
|---|---|---|---|---|
| And | Display just the selected inputs | AND [Underlying] = MSFT AND Qty > 1000 | Displays only those positions with MSFT as the underlying and with a quantity greater than 1000 | OR [Symbol] = MSFT OR [Symbol] = IBM |
| Or | Display all of either of the selected inputs | Displays all positions with either MSFT or IBM as the symbol | ||
| Not And | Display all except for the selected inputs. All conditions are met as a whole. | NOT AND [Symbol] = MSFT NOT AND [Qty] > 1000 | Displays all positions except MSFT with a quantity greater than 1000. (Both conditions must be met, i.e. 999 shares or less of MSFT will display on the spreadsheet) | |
| Not Or | Display all except for the selected inputs. Conditions are met individually. | NOT OR [Symbol] = MSFT NOT OR [Qty] > 1000 | Displays all positions except for MSFT and any position that has a quantity that is not greater than 1000. In other words, all positions that are not MSFT and up to 999 quantity. |
- B. Add Condition Add a condition statement
- Alternative ways to add conditions (while in the Filter Editor):
- A. Clicking the plus
 icon next to the logical operator will also add a condition statement
 - B. Press the Insert key
 or the plus key on your keyboard
- C. Click the delete
 icon next to the condition statement to remove it from the filter or use the Delete
  or subtract
  keys on your keyboard.
| Field | Description |
|---|---|
| Add Group | Add a logic operator |
| Clear All | Clear all condition statements in the filter editor window |
- C. Inputs
- The input fields are comprised of the data set (before condition statement) and the value (after condition statement).
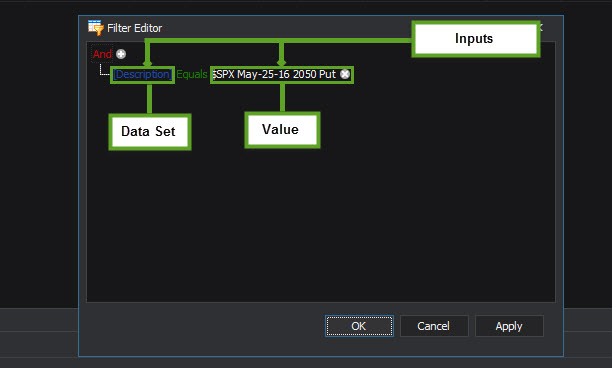
| Field | Description |
|---|---|
| Data Set | Select a column data set for which to filter. The column data sets available is dependent on the module that you are creating the filter within. |
| Value | Set the value(s) for which to apply the conditional statement to the data set. |
5. Building a Custom Auto Filter
5.1 Getting Started
- The (Custom) filter edit window is accessed by clicking the funnel icon and selecting (Custom)
- This filter is based around the column data set that the auto filter was launched from.
- In this example, the Custom Auto Filter was launched from the % Change column header

- You can enter up to two (2) conditions in the Auto Filter window.
| Example: | Steps | Details |
|---|---|---|
| Define what you want: | Let's say you have a lot of symbols on your Quote Board and want to narrow your display to view only those symbols that have moved more than 5% on the day, either up or down. | |
| Identify the conditions: | Since we are looking for absolute movement greater than 5%, we have two conditions that we are needed: greater than +5% or less than -5%. | |
| Identify the logic operator: | The Or operator is needed here since we want to display only those symbols that meet either condition. The And operator would display only those symbols that meet both conditions simultaneously (which would display no symbols because you can't have both positive and negative % change at the same time). | |
| Build the filter: | Here is what the completed filter looks like for this example: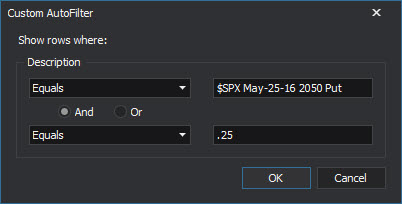 |
Note: Percentage is entered in its decimal equivalent format.
6. Useful Filter Examples
6.1 Options expiring ITM
- In the portfolio module, filters make it easy to view if you have any options that are currently ITM for the current expiration cycle.
| Steps | Details |
|---|---|
| Define what you want: | Show all options that are currently ITM and are expiring on or before MM-DD-YY. |
| Identify the conditions: | [Security Type] Equals ITM [Expiration] Is less than or equal to MM-DD-YY |
| Identify the logic operator: | We want both conditions to be met simultaneously, therefore we use And |
| Build the filter: | Right-click any column header in the Portfolio module and select Filter Editor 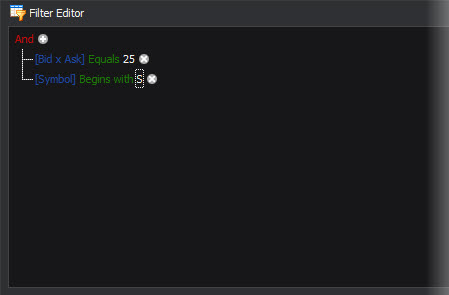 |