Volatility Skew
Table of Contents
1. Introduction
1.1 Purpose
This document provides an overview of the SILEXX OEMS Volatility Skew Module. Therefore, our intent here is to provide you guidance, on both basic and advanced functionalities.
In this manual we will cover how to:
- Launch the Volatility Skew module
- Reading the Volatility Skew Graph
- Adjusting and Applying Volatility Skews
- Edit Stored Volatility Skews
2. Launching the Volatility Skew Module
2.1 Launching the Volatility Skew Module from the Main Screen
- Click Modules
- Select Volatility Skew

2.2 Launching the Volatility Skew from the Option Chain
- Right-click a strike row 2.Select Edit Volatility Skew

3. Reading the Volatility Skew Graph
3.1 Graph
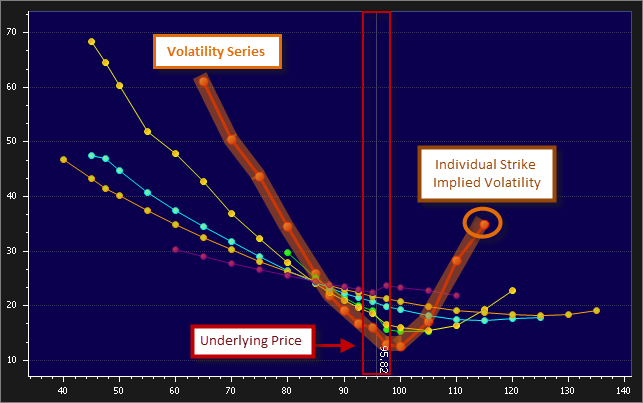
- Each colored line represents a series of option implied volatility values for a specific expiration month
- Each point on a line represents the implied volatility for a specific Strike price
- Current underlying price is displayed as a vertical line on the graph
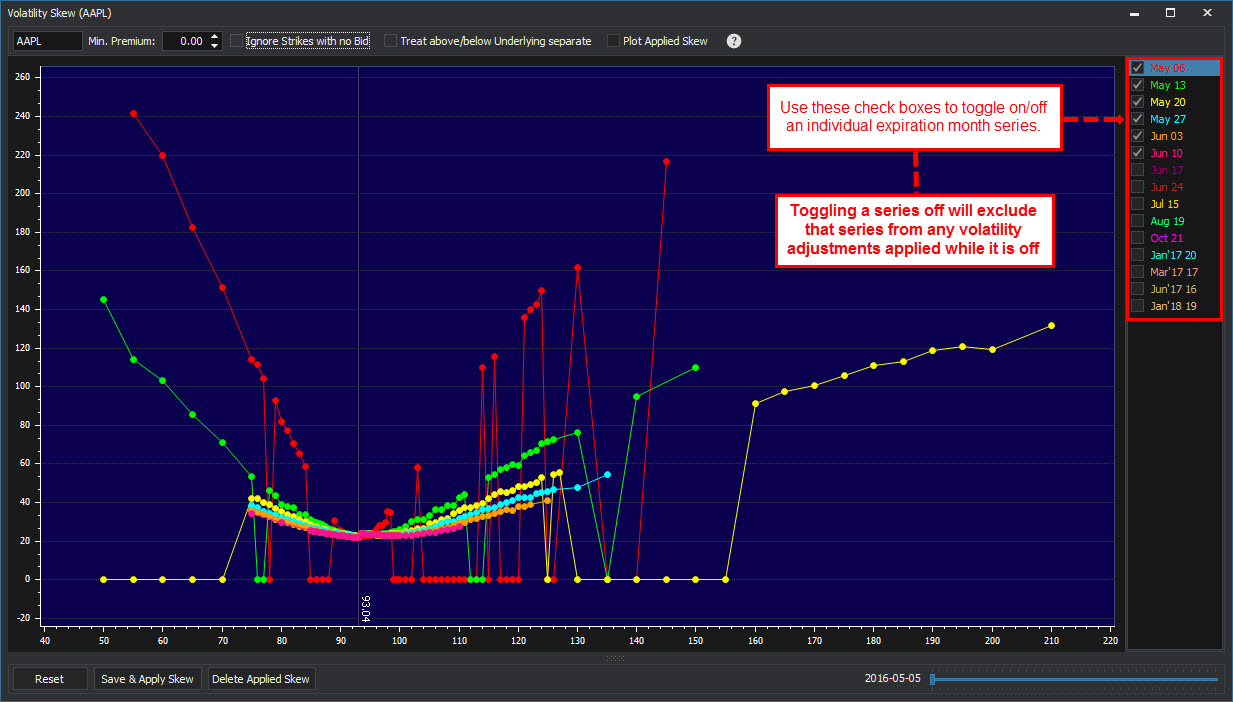
An expiration series can be toggled on/off using the check boxes to the right of the graph
TOP BAR

| Field | Description |
|---|---|
| Underlying | Current active underlying security |
| Min. Premium | Modify only the Strikes that are priced at a minimum value; ignore those below that value |
| Ignore Strikes with no Bid | Apply volatility changes only to those Strikes that have a Bid price |
| Treat above/below Underlying separate | Change the volatility values for the strikes above and below the current underlying price separately. |
| Plot Applied Skew | Check this box to plot an existing applied volatility skew. When left unchecked, the default graph will display the current market implied volatility values. |
BOTTOM BAR

| Field | Description |
|---|---|
| Reset | Reset Resets the graph to the current market implied volatility values |
| Save and Apply Skew | Save the changes made to the volatility skew. When applied, the volatility changes appear globally in SILEXX OEMS for the underlying security. |
| Delete Applied Skew | Remove all applied volatility changes for the active underlying symbol |
| Date Slider | Click and drag to adjust the display based on calendar days moving forward in time. |
TIP: ![]() Use the keyboard arrow keys for fine tuning the date.
Use the keyboard arrow keys for fine tuning the date.
4. Adjusting and Applying Volatility Skews
4.1 Graphical Adjustments
- Click and drag the data points on the graph to adjust the volatility skew for an entire series or individual points.
Left-click and drag to adjust the implied volatility for an entire expiration month series.
- Right-click and drag to adjust individual strike implied volatility values
Tip: Check the box labeled "Treat above/below Underlying separate" to adjust the skew of the strikes above the underlying price independently from those below the underlying price, and vice versa.
- Click and drag the underlying price to adjust the model based on hypothetical changes in the underlying price.

- Click the Save and Apply Skew button to apply your adjustments globally for the active underlying security.
- Implied volatility values that have been modified are highlighted on the Option Chain module for easy visual reference.

5. Editing Stored Volatility Skews
5.1 All applied volatility adjustments are stored for editing in the following location:
- Click Tools
- Select Edit Stored Volatility Skews

- This will open the "Edit Stored Volatility Skews" window which list all your applied volatility skews.

| Field | Description |
|---|---|
| Delete | Delete an individual applied volatility skew Click the X to delete a single skew from the list |
| Symbol | Option symbol ID has an applied skew |
| Volatility | Volatility value applied to the specific option symbol, click in the cell edit a volatility value for a specific symbol, manually enter the value or use the arrow buttons to adjust the value |
| Clear All | Remove all applied volatility skews |
| Close | Exit the Stored Volatility Skews edit window |
To Top