Position Analyzer
Table of Contents
- 1. Introduction
- 2. Launching the Position Analyzer Module
- 3. Creating Positions in the Position Analyzer Module
- 4. Loading Existing Positions into the Position Analyzer
- 5. Reading the Information on the Position Analyzer module
- 6. Manipulating the Risk Graph Display
- 7. Customizing the Position Data Display
1. Introduction
1.1 Purpose
This document provides an overview of the SILEXX OEMS Position Analyzer Module. Therefore, our intent here is to provide you guidance, on both basic and advanced functionalities. The Position Analyzer module gives a graphical representation of positions, P&L and Greeks.
In this manual we will cover how to:
- Launch the Position Analyzer
- Create positions to analyze
- Load and analyze existing positions in the Position Analyzer
- Read the information on the Position Analyzer
- Manipulate the graphical display
2. Launching the Position Analyzer Module
A Position Analyzer window can be accessed from any of the following modules:
- Main Screen
- Portfolio
- Complex Order Ticket
- Risk Radar
2.1 From the Main Screen
A. Click Modules and select Position Analyzer

B. Enter a symbol

This opens a blank Position Analyzer module with the input underlying.
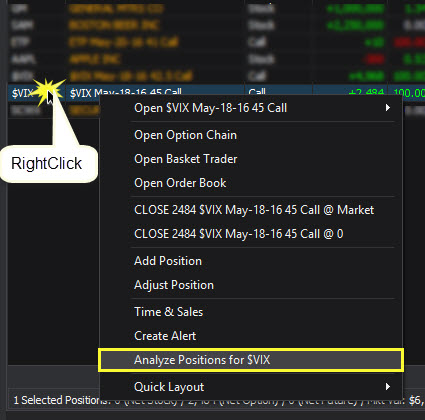
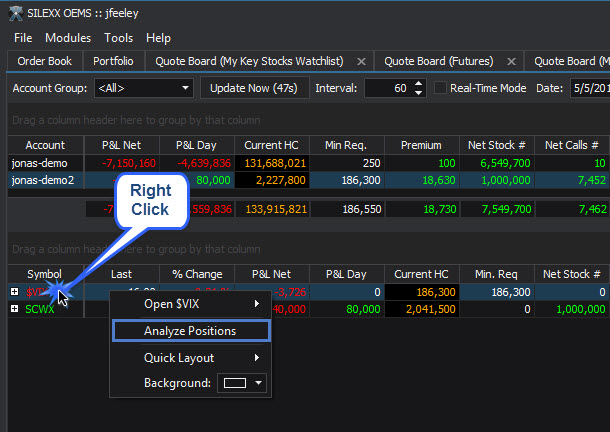
2.2 From the Portfolio
Right-click a security's row and select Analyze Positions for underlying

The analyzer module will load all positions currently held for the selected underlying security.
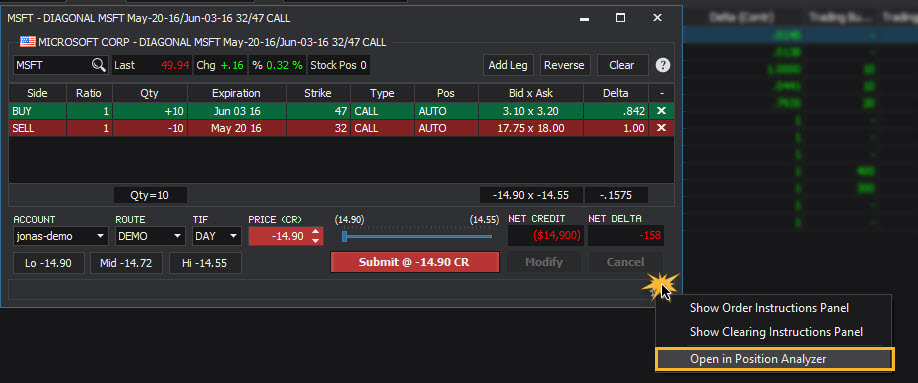
2.3 From the Complex Order Ticket
Click the gear icon and select Open in Position Analyzer
2.4 From the Risk Radar
- Expand an account to view positions grouped by underlying
- Right-click anywhere in the row of the underlying symbol and select Analyze Positions for underlying The analyzer module will load all positions currently held for the selected underlying security.

3. Creating Positions in the Position Analyzer Module
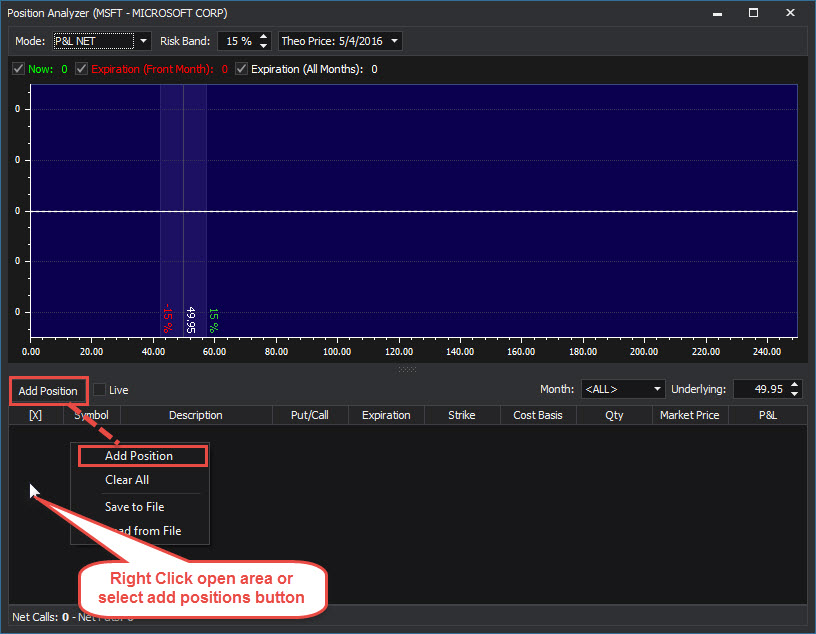
3.1 Building a position directly in the Position Analyzer module
- Click the Add Position button in the positions section of the module
- Right-click in the positions section of the module and select Add Position
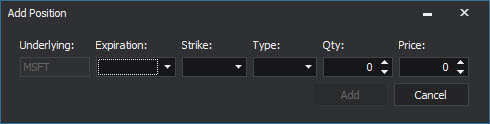
Fill out the details of the leg in the Add Position window and click the Add button when completed:
3.2 Drag and Drop from an Option Chain

4. Loading Existing Positions into the Position Analyzer
4.1 Loading from the Portfolio
- Right-click a security's row and select Analyze Positions for underlying
4.2 Loading from the Risk Radar
- Expand an account to view its positions grouped by the underlying symbol
- Right-click anywhere in the row of the underlying symbol and select Analyze Positions for underlying
Note: When loading as illustrated above, the analyzer window loads all the open positions in that underlying security.
5. Reading the Information on the Position Analyzer module
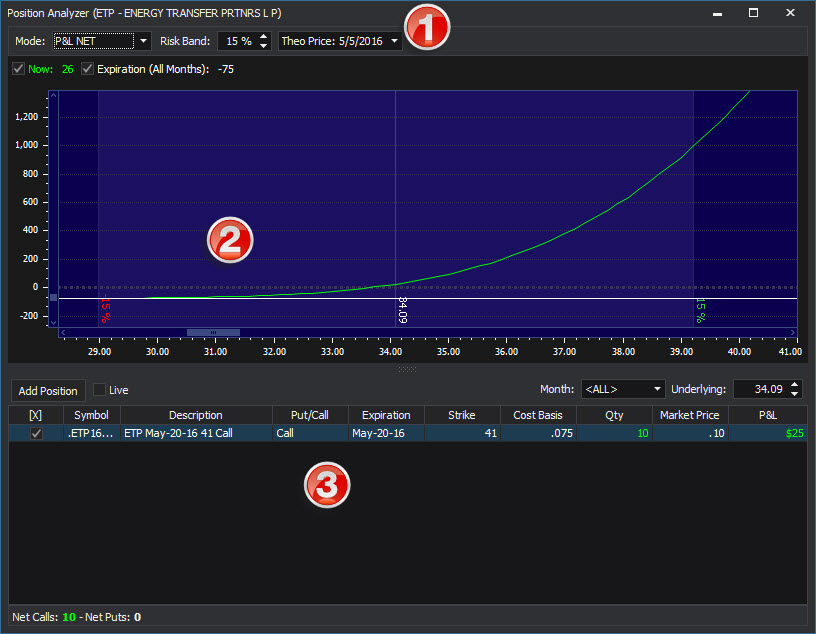
5.1 Header Controls

| Field | Description |
|---|---|
| Mode | Sets the type of graph displayed (all risk plots are graphed over underlying price movement) |
| P&L | Net Profit / Loss |
| Delta | Net Delta |
| Gamma | Net Gamma |
| Vega | Net Vega |
| Theta | Net Theta |
| Rho | Net Rho |
| Risk Band | Sets a visual representation (band) of theoretical "risk" based on a percentage move of the underlying security price. |
| Theo Price | Allows you to establish a theorectical date parameter |
5.2 Risk Graph

Axis
Horizontal Underlying security price
- Vertical
- The values graphed on the vertical axis are net values and depend upon the graph mode:
| Mode | Display |
|---|---|
| P&L | Net Profit / Loss |
| Delta | Net Delta |
| Gamma | Net Gamma |
| Vega | Net Vega |
| Theta | Net Theta |
| Rho | Net Rho |
Risk Curves
| Line Color Display | Description |
|---|---|
| Green Line | Current risk profile |
| Red Line | Risk profile at expiration of the front month options |
| White Line | Risk profile at expiration of all options |
Risk Band
Visual representation of a zone of price movement. The default Risk Band setting is 15%. This shows the extent of a 15% move of the underlying price (up or down) from the current price.
Current Price Line
Vertical line representing the current price of the underlying security
Tip: The current value of the graphed position is where the green risk line intersects this line.
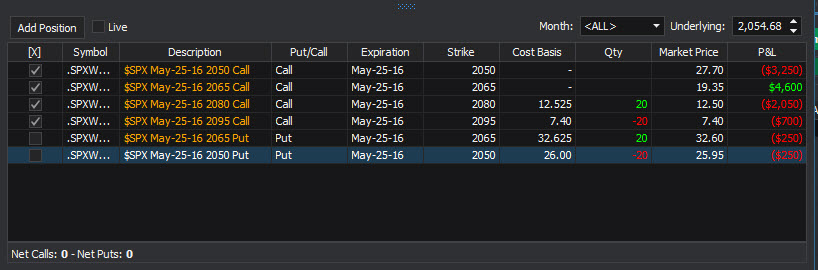
5.3 Position Details
Lists the positions that are part of the risk graph calculations
Top Bar

| Field | Description |
|---|---|
| Add Position | Click to create and add a new position (with the same underlying) to the analyzer window |
| Live | If checked the graph displays live market data, else the data is as of the time the graph was opened |
| Month | Select a month to view just the positions expiring that cycle. All other legs will be deselected and inactive. |
| Underlying | You can make theoretical adjustments to the underlying price to see the effect of price movement on the position's net values |
Summary Bar

| Field | Description |
|---|---|
| Net Calls | Displays the Net number of Call option contracts for the active position(s) |
| Net Puts | Displays the Net number of Put option contracts for the active position(s) |
Right-click Menu

| Field | Description |
|---|---|
| Add-Position | Add a new position to the analyzer window |
| Clear All | Clears all active position within analyzer window |
| ReLoad from Account | Load positions for an existing account into the analyzer position window |
| Save to File | Save the positions in the analyzer to a file folder for later reference |
| Load from File | Load a saved analyzer position file from a file folder |
6. Manipulating the Risk Graph Display
6.1 Zoom
- Use the mouse scroll-wheel to zoom in and out on the risk graph.
- Left-click and drag the graph axis to re-scale the graph
- Hold the Shift key and left-click and drag to create a zoom window
6.2 Pan
- Left-click and drag the graph display
- Use the pan scrollbars above the horizontal and vertical axes to pan
6.3 Risk curve visibility controls
Above the risk graph are a set of checkboxes that allow you to toggle on/off individual risk curves

| Field | Description |
|---|
Now If checked, the current risk graph of the active position is displayed (green line) Expiration (All Months) If checked, the expiration risk graph of the active position is displayed (white line) The numbers associated with each type of curve represent the net value of the Mode of the graph
7. Customizing the Position Data Display
7.1 Column Customization
The data displayed on the Order Book Spreadsheet can be customized by adding / removing, resizing, and re-ordering columns.
Click here for the complete guide to Column Customization
7.2 Position Analyzer Column Data Definitions
| Field | Description |
|---|---|
| [X] | Checkbox column - If checked, the leg will be included (active) in the graphical calculations, otherwise that leg is excluded from the risk curve calculations. |
| Cost Basis | Adjustable cost basis for the position |
| Description | Description of the security |
| Expiration | Option contract expiration date (month/day/year) |
| Market Price | Represents the Mark price of the option at the time the analyzer window was opened. If the Live checkbox is checked, it represents the current market Mark price of the position (during market hours) |
| Net P&L | Current net profit or (loss) for the position |
| Put/Call | Put or Call option identifier |
| Qty | Quantity |
| Strike | Strike price of an option contract position |
| Symbol | Security's symbol identifier |